This section shows a detailed status of the GSLB farm Backend Stats, Client requests, Server requests, and Extended Stats.
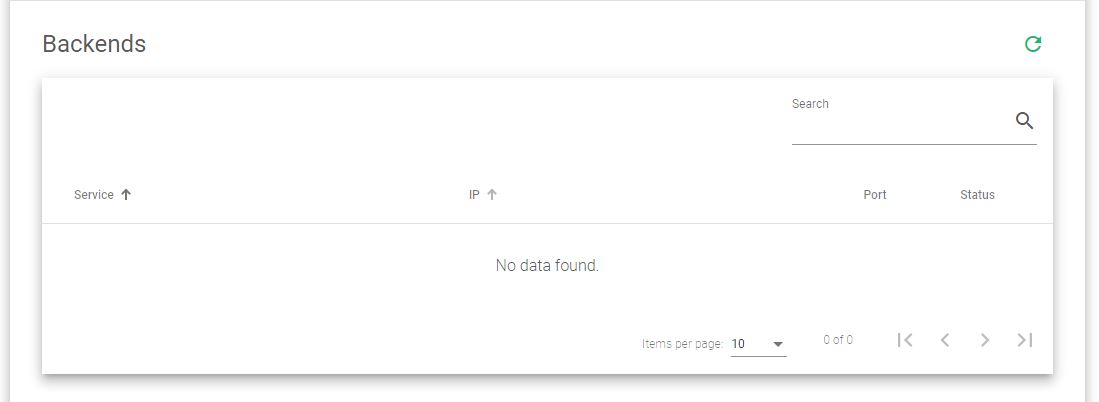
GSLB Backend Stats
The Backends Stats table shows the following information:
Service. A descriptive name of the farm service.
IP. The IP address of the backend.
Port. The TCP port of the backend to be checked.
Status. The current status of the backend.
- Green. Means the backend is UP and running normally.
- Red. Means the farm is UP but the backend is unreachable.
- Gray. Means the status of the farm is unknown. When the farm is stopped and the backend is not in maintenance mode, the backend status remains unknown until the farm is started.
GSLB Client Stats
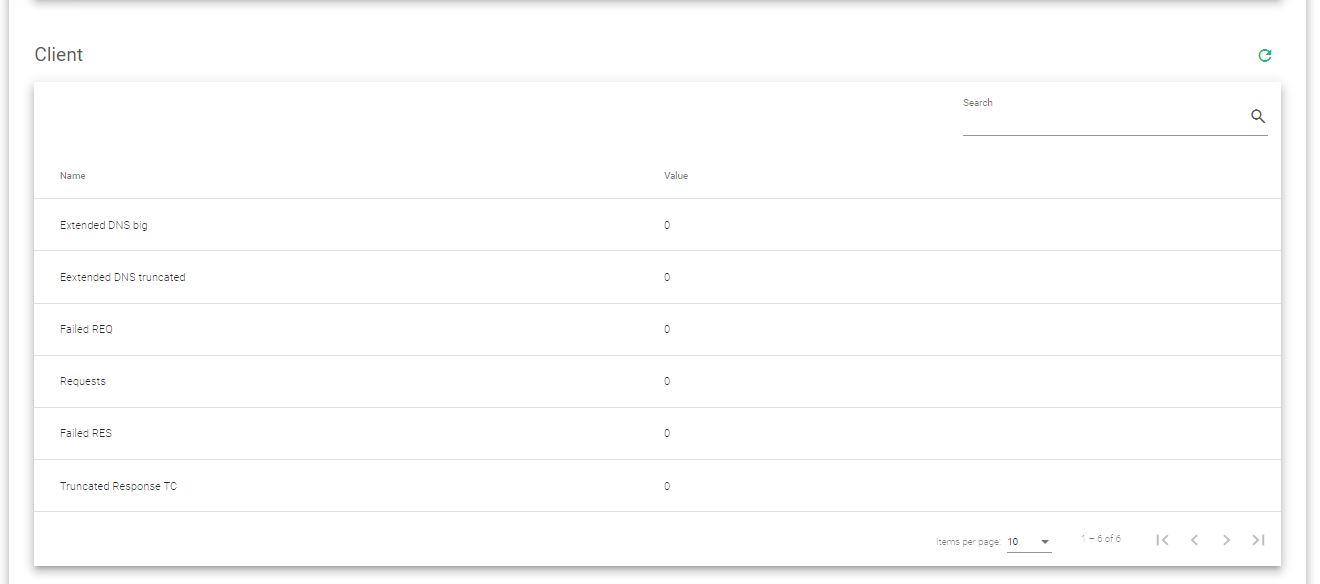
The Client table shows information about DNS queries requested by the GSLB farm and its responses. It includes the following information:
Extended DNS Big. A huge number of EDNS UDP responses.
Extended DNS Truncated. The number of truncated EDNS responses because they were too long.
Failed REQ. Failed requests from clients.
Requests. The total client requests.
Failed RES. Failed responses to clients.
Tuncated Response TC. Responses were truncated because they were too long. TC bit is activated and indicated to the client.
GSLB Server Stats
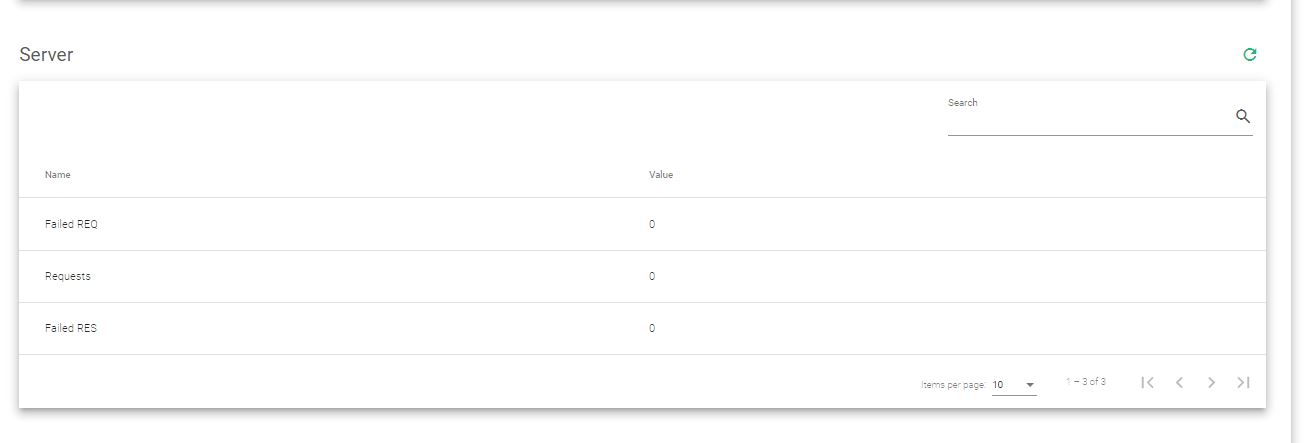
The
Requests. Several requests were forwarded to the backends.
Failed Requests. Several failed requests from the clients.
Failed Responses. Several failed responses from backends.
GSLB Extended Stats
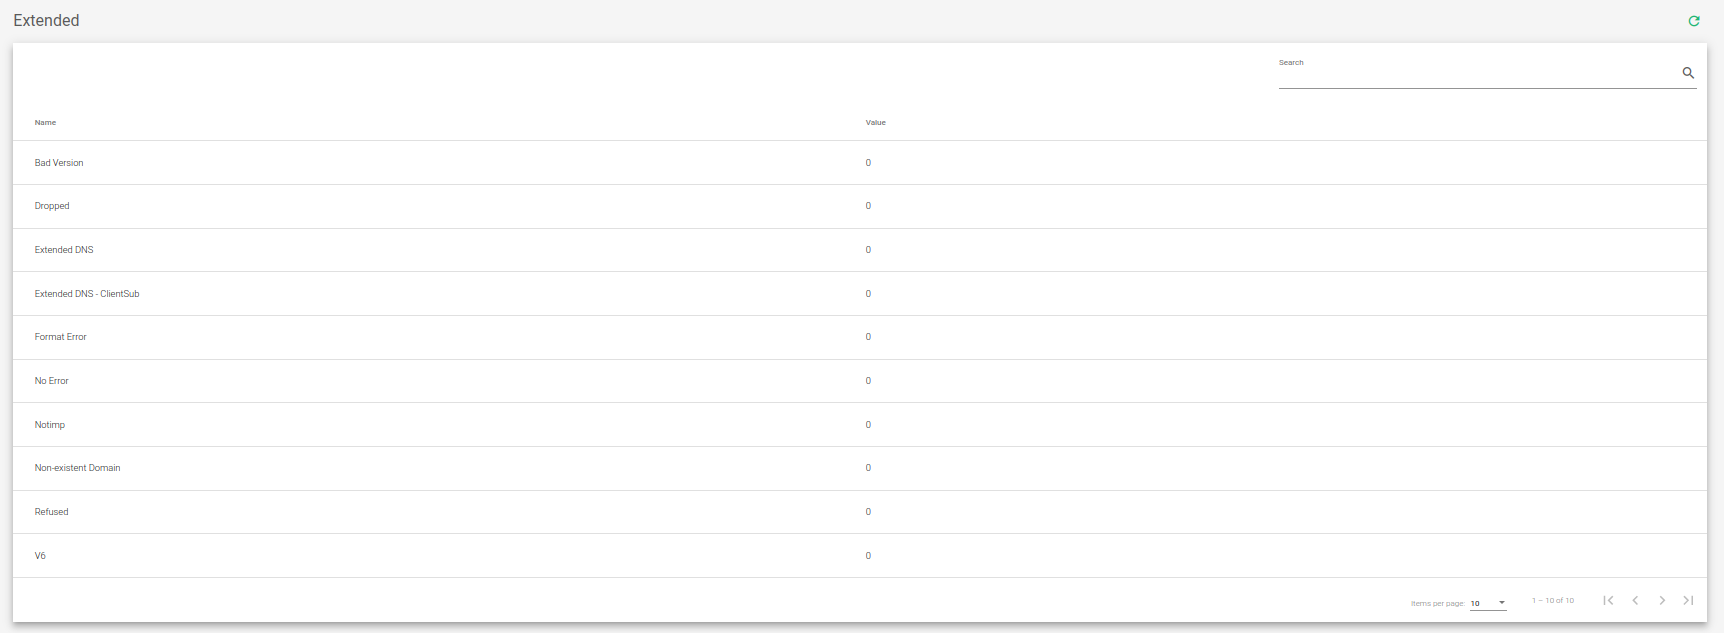
The
Bad Version: DNS requests with a wrong DNS version number.
Dropped:. DNS queries dropped by DNS servers.
Extended DNS: DNS queries using EDNS.
Extended DNS-Clientsub: DNS queries using EDNS with client subnet extension.
Format Error: DNS queries with the wrong format.
No Error: DNS transactions that are successfully done.
NotImp: DNS requests are answered with a NotImp error. This error means that the DNS server does not implement DNS update requests.
Non-Existent Domain: DNS queries asking for a domain that can’t be resolved.
Refused: DNS refused requests.
V6: DNS queries requesting an IPv6 address.
By default, the statistics in this section will show a single sample of the information shown for the current farm, but it is also possible to configure 10, 30, 60, and 120 seconds.


