POSTED ON 2 October, 2017
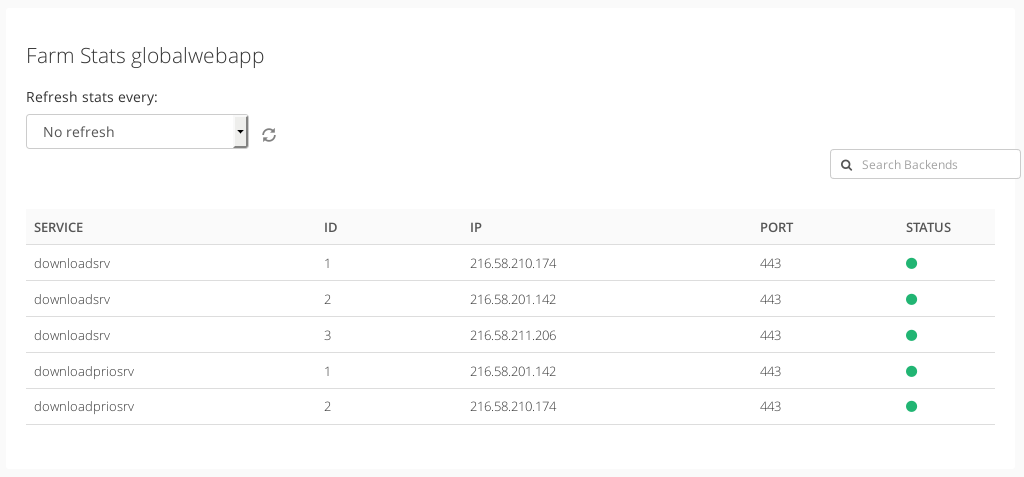
This section shows a detailed status of the GSLB Services, Client requests and Backend stats.
The Services table shows the following information:
- SERVICE. Farm service name referred.
- ID. Index of the service backend.
- IP. IP address of the backend.
- PORT. TCP port checked of the backend.
- STATUS. Current status of the backend health check.
- Green bullet = Means Backend is running normally.
- Orange bullet = Means the Backend is on maintenace mode.
- Red bullet = Means the farm is up but the backend is not reachable.
- Gray bullet = When the farm is stopped and the backend is not on maintenance mode the real backend status remains unknown until the farm is started and the the check is execucted.
The Client Stats table shows the DNS queries requested to the GSLB farm and responses that includes the following information:
- REQS. Client requests.
- RECEIVE FAIL. Failed requests from clients.
- SEND FAIL. Failed responses to clients.
- TRUNCATED RESPONSE (TC).
- EXTENDED DNS BIG.
- EXTENDED DNS TC.
The Server Stats section shows the DNS queries and responses to and from the backends that includes the following information:
- REQS. Requests to the backends.
- RECEIVE FAIL. Failed requests to the backends.
- SEND FAIL. Failed responses from the backends.
The Extended Stats section shows some GSLB farm additional information about the number of valid requests, errors or problems with the DNS requests:
- NO ERROR.
- REFUSED.
- NON-EXISTENT DOMAIN.
- NOTIMP.
- BAD VERSION.
- FORMAT ERROR.
- DROPPED.
- V6.
- EXTENDED DNS.
- EXTENDED DNS-CLIENTSUB.
By default the statistics in this section will show a single sample of the information shown for the current farm, but it is also possible to configure 10, 30, 60 and 120 basis seconds.
Documentation under the terms of the GNU Free Documentation License.

